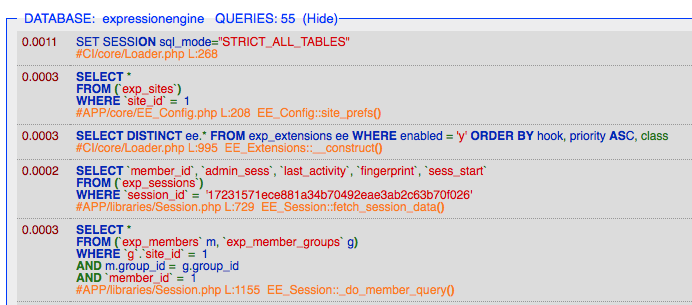
One of our sites has been really suffering and our ISP pointed out that we needed to optimize our templates because we were generating some really slow queries.
For example this:
SELECT DISTINCT(t.entry_id) FROM exp_channel_titles AS t
            LEFT JOIN exp_channels ON t.channel_id = exp_channels.channel_id LEFT JOIN exp_members AS m ON m.member_id = t.author_id INNER JOIN exp_category_posts ON t.entry_id = exp_category_posts.entry_id
                     INNER JOIN exp_categories ON exp_category_posts.cat_id = exp_categories.cat_id WHERE t.entry_id !='' AND t.site_id IN ('1')  AND t.entry_date < 1399575836  AND (t.expiration_date = 0 OR t.expiration_date > 1399575836) AND t.entry_id != '2706' AND (t.channel_id = '1' OR t.channel_id = '3' ) AND t.entry_id IN ('164','162','356','354','145','180','230','221','218','207','243','244','254','256','257','272','281','283','308','309','314','315','318','319','323','324','329','330','331','332','333','337','338','343','346','348','349','350','351','359','360','361','362','363','371','376','384','393','394','409','411','426','450','455','470','471','480','488','507','509','513','514','517','522','527','529','532','538','539','557','559','560','563','582','583','584','588','604','609','613','614','617','621','625','633','641','650','652','682','813','674','676','677','678','679','688','694','696','699','704','712','718','724','726','728','732','757','758','759','763','770','783','778','784','794','796','799','810','822','828','837','1216','871','843','844','845','846','847','855','861','863','864','865','866','868','873','887','888','879','884','890','891','892','896','900','902','907','912','913','914','916','917','918','924','925','929','955','935','936','940','946','950','953','954','95! 7','961','965','967','968','1169','981','983','998','999','1131','1005','1007','1014','1019','1026','1185','1030','1031','1032','1045','1046','1050','1056','1078','1073','1075','1081','1088','1094','1099','1109','1116','1120','1124','1144','1151','1152','1153','1154','1156','1158','1161','1163','1166','1172','1241','1195','1198','1199','1200','1201','1204','1591','1209','1215','1220','1223','1226','1232','1233','1245','1246','1257','1258','1261','1270','1274','1275','1279','1280','1283','1288','1289','1300','1301','1303','1308','1312','1313','2378','1345','1351','1354','1357','1366','1372','1379','1386','1387','1390','1405','1393','1402','1403','1416','1417','1420','1421','1423','1430','1432','1434','1447','1450','1455','1465','1468','1469','1473','1475','1478','1481','1487','1488','1503','1506','1507','1512','1513','1517','1520','1521','1546','1547','1548','1550','1571','1557','1558','1559','1561','1564','1565','1567','1568','1595','1600','1604','1609','1614','1613','1624'! ,'1641','1633','1638','1644','1645','1650','1653','1655','1658! ','1659','1660','1662','1663','1676','1677','1687','1688','1690','1693','1697','1699','1700','1701','1703','1704','1705','1711','1713','1715','1718','1722','1726','1730','1731','1738','1742','1744','1752','1759','1762','1767','1768','1772','1773','1776','1797','1779','1782','1791','1795','1810','1813','1815','1828','1840','1841','1843','1844','1845','1860','1861','1867','1885','1879','1888','1889','1892','1893','1894','1900','1904','1910','1914','1912','1915','1921','1925','1927','1929','1930','1939','1948','1949','1952','1954','1956','1958','1959','1974','1976','1985','1988','2001','2002','2003','2007','2015','2014','2020','2324','2033','2034','2035','2039','2046','2044','2048','2052','2059','2057','2061','2062','2066','2078','2075','2082','2102','2124','2129','2128','2225','2144','2146','2177','2184','2187','2188','2192','2193','2197','2199','2201','2212','2222','2226','2227','2234','2240','2245','2246','2253','2274','2275','2276','2293','2297','2299','2301','2304','2314'! ,'2323','2334','2343','2348','2351','2363','2367','2368','2369','2379','2382','2387','2400','2405','2416','2417','2420','2434','2440','2442','2445','2452','2458','2460','2462','2463','2473','2480','2484','2497','2499','2502','2505','2509','2511','2520','2521','2523','2525','2530','2531','2537','2547','2553','2557','2566','2592','2598','2602','2608','2612','2638','2641','2643','2645','2648','2651','2655','2658','2661','2663','2694','2665','2693','2700','2701','2702','2704','2708','2709','2739','2736','2722','2723','2725','2727','2729','2731','2733','2737','2746') AND t.status  IN ('open','draft') AND t.status != 'closed' ORDER BY t.sticky desc, t.entry_date desc, t.entry_id desc LIMIT 0, 5
So yeah, that's a mess. But how would I identify what EE tag is generating it so I can find a better solution?
Any tips on tracking these things down?


